Weather Observer
Weather Observer is our desktop application that allows you to access your Weather Station.
Weather Observer
Weather Observer, our desktop application is written in HTML5 and is available for Mac and Windows. You can use it as a standard downloadable application or directly in your browser from the wxswitchconnect portal. It consists in five views: Dashboard, Charts, Data, Presentations and Alarms.
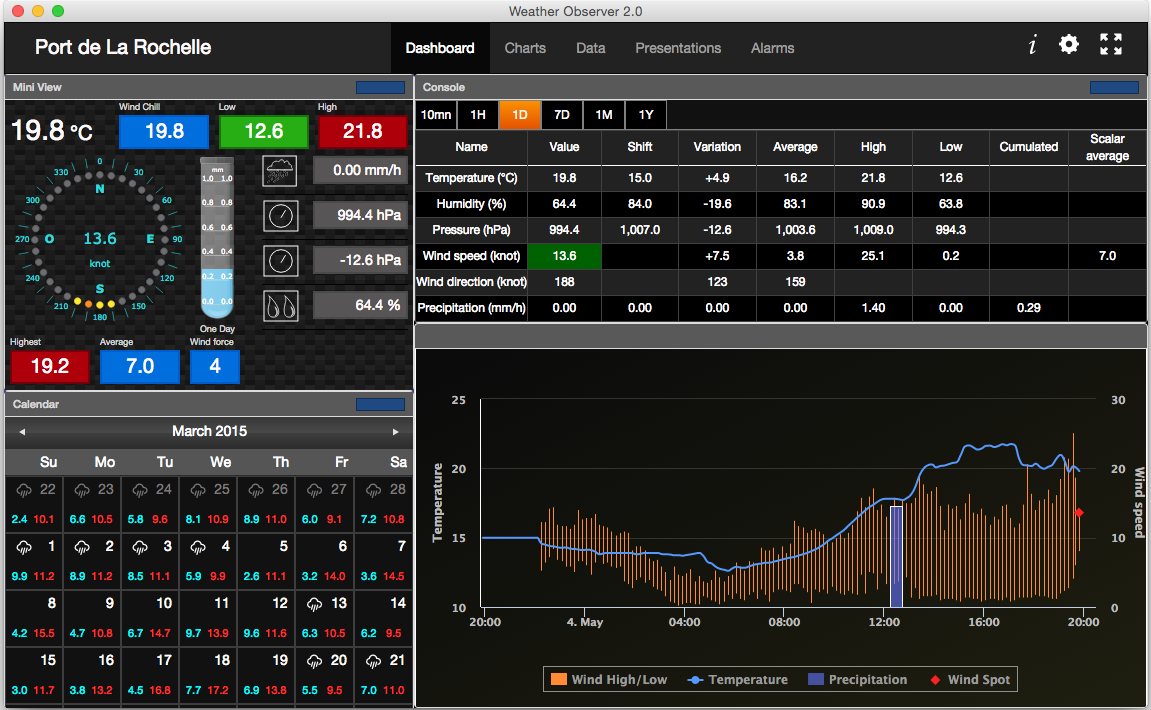
The Dashboard
The Dashboard has been designed to check weather conditions at a glance. It provides a set of five small widgets that give the most essential information.
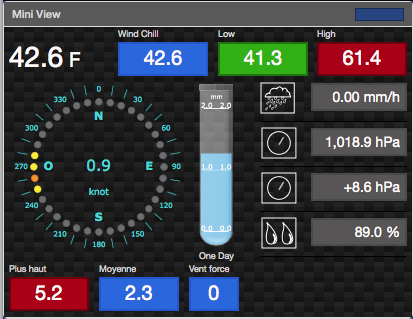
Miniview
The mini view just displays the most essential weather indicators.
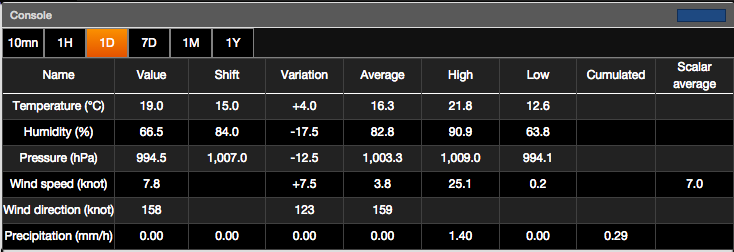
Console
The Console displays tons of indicators calculated in near real time calculated from base indicators.
Given a predefined period of time, for example, 24 hours, you can immediately check:
- The shift value, that is the value of the parameter exactly 24 hours ago
- The variation
- The average
- The high and low values
- The cumulated value, for precipitation
- The scalar average of wind speed
With this feature you can for example check the exact temperature variation over one year.
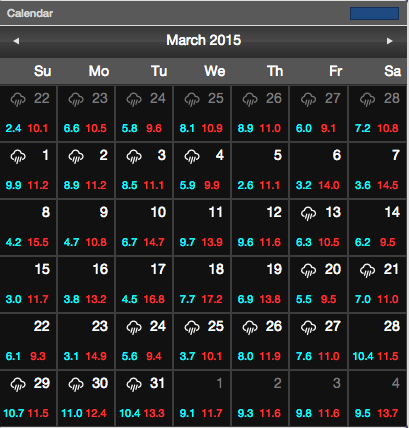
Calendar
The calendar provides an easy way to check daily data. A day cell displays the high/low temperature. A rain icon appears if precipitation occurred this day.
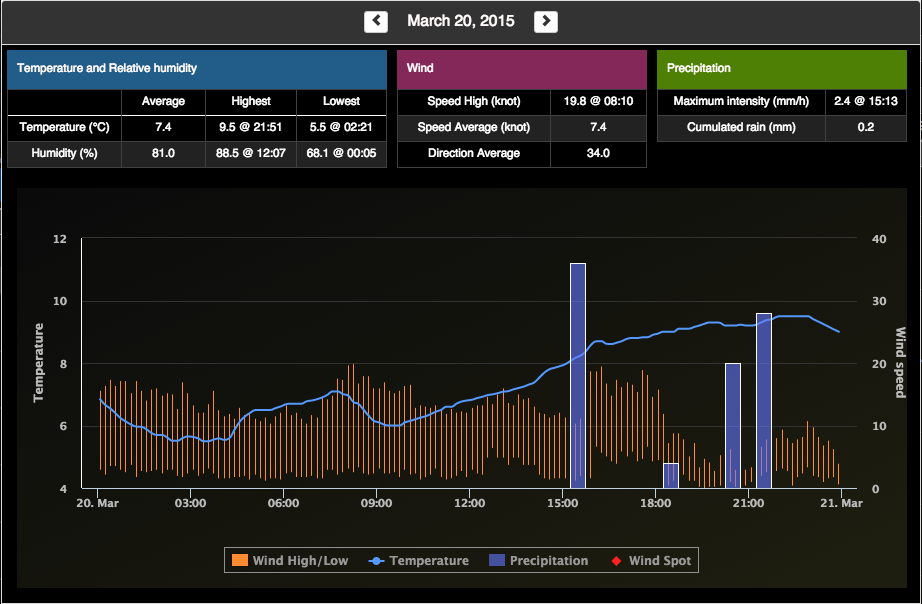
Calendar detail
Clicking a day displays a complete report relative to this day.
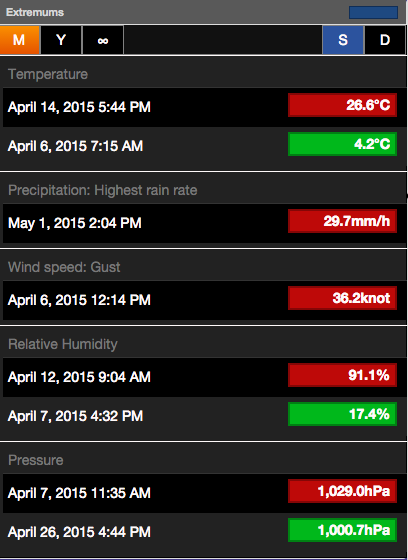
Extremum
The extremum panel displays high and low values over one month, one year or forever. There are two ways to define what an extremum value is:
- One is to consider an extremum is a precise instant of time: for example April 14, 2015 at 5:44am. You get this information with the 'S' button that stands for 'Spot'.
- The other is to consider a whole day and check the average (or rainfall for precipitation): for example April 14, 2015. You get this information with the 'D' button that stands for 'Day'.
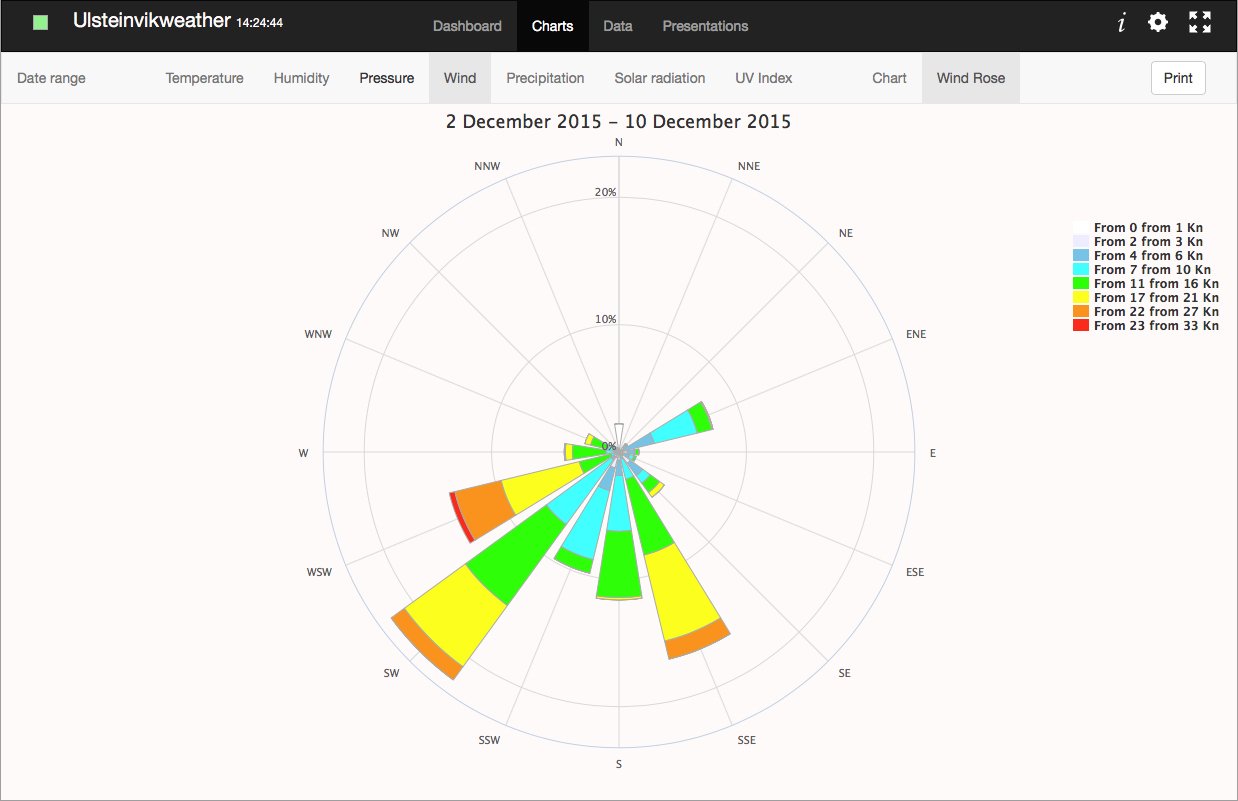
The Charts panel
The Charts view displays a graphical representation of the various variables of your weather station. You can select any period of time through the 'Date Range' menu item.
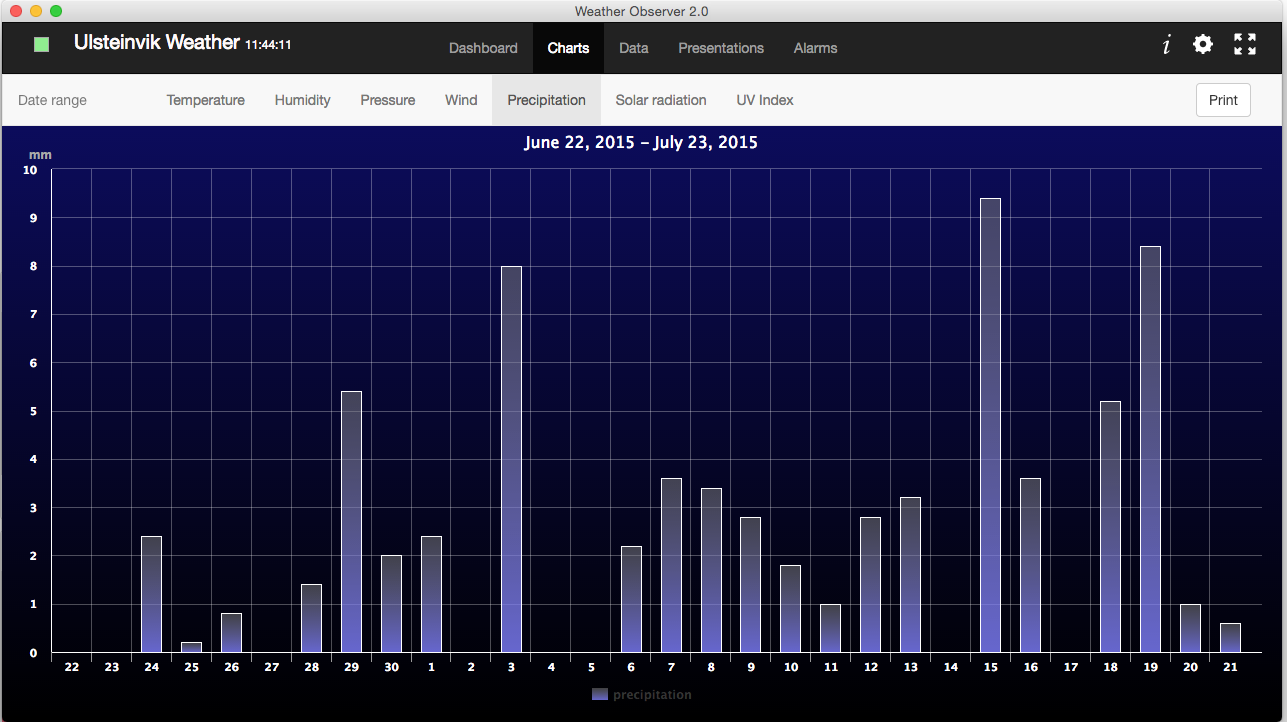
Weather Observer can also display a Wind Rose that gives a view of how wind speed and direction are typically distributed.
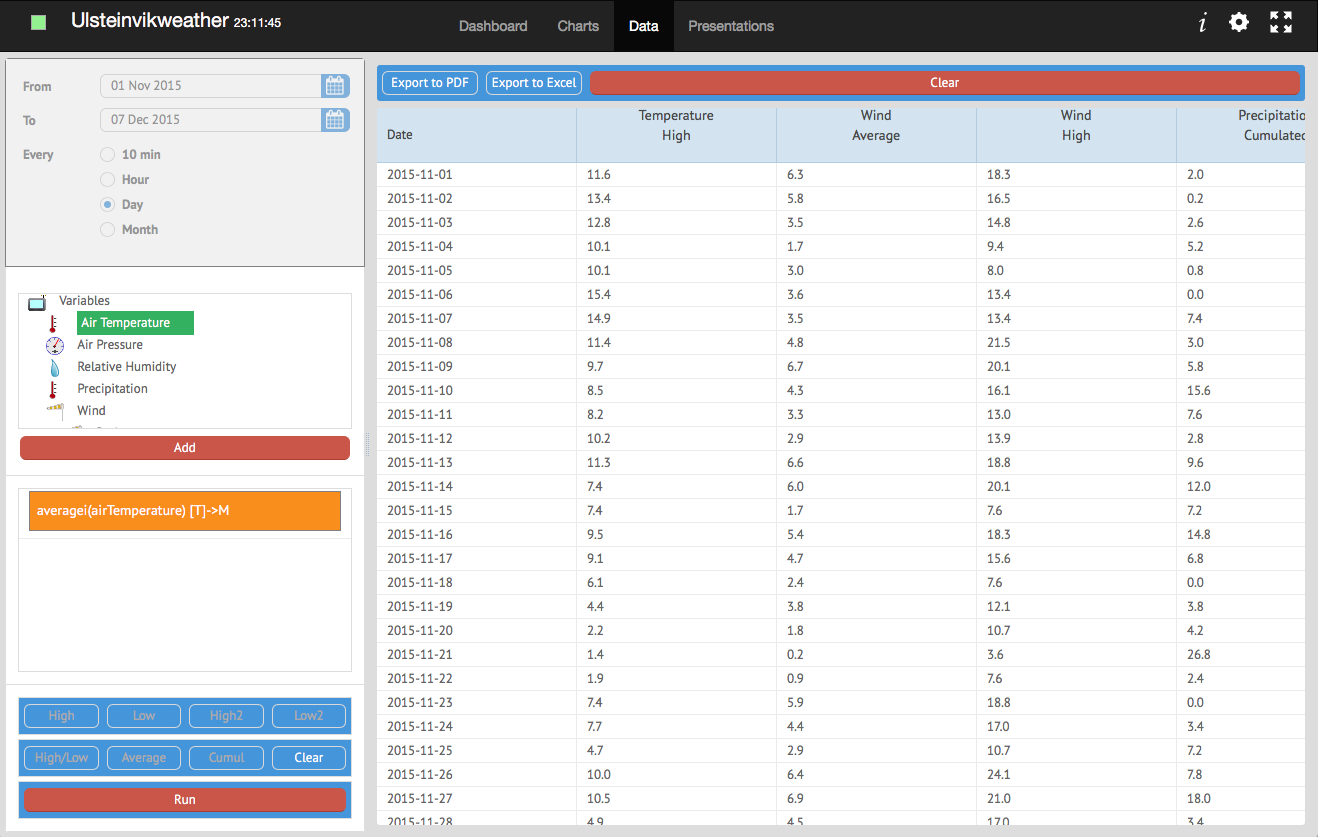
The Data panel
The Data panel allows you to visualize and export all kinds of data for any period of time.
The left side contains the Query Builder allowing you to select the time range of your query and the data you want to retrieve.
The right side contains the result of your query. You can easily export the results as a PDF or an excel spreadsheet.
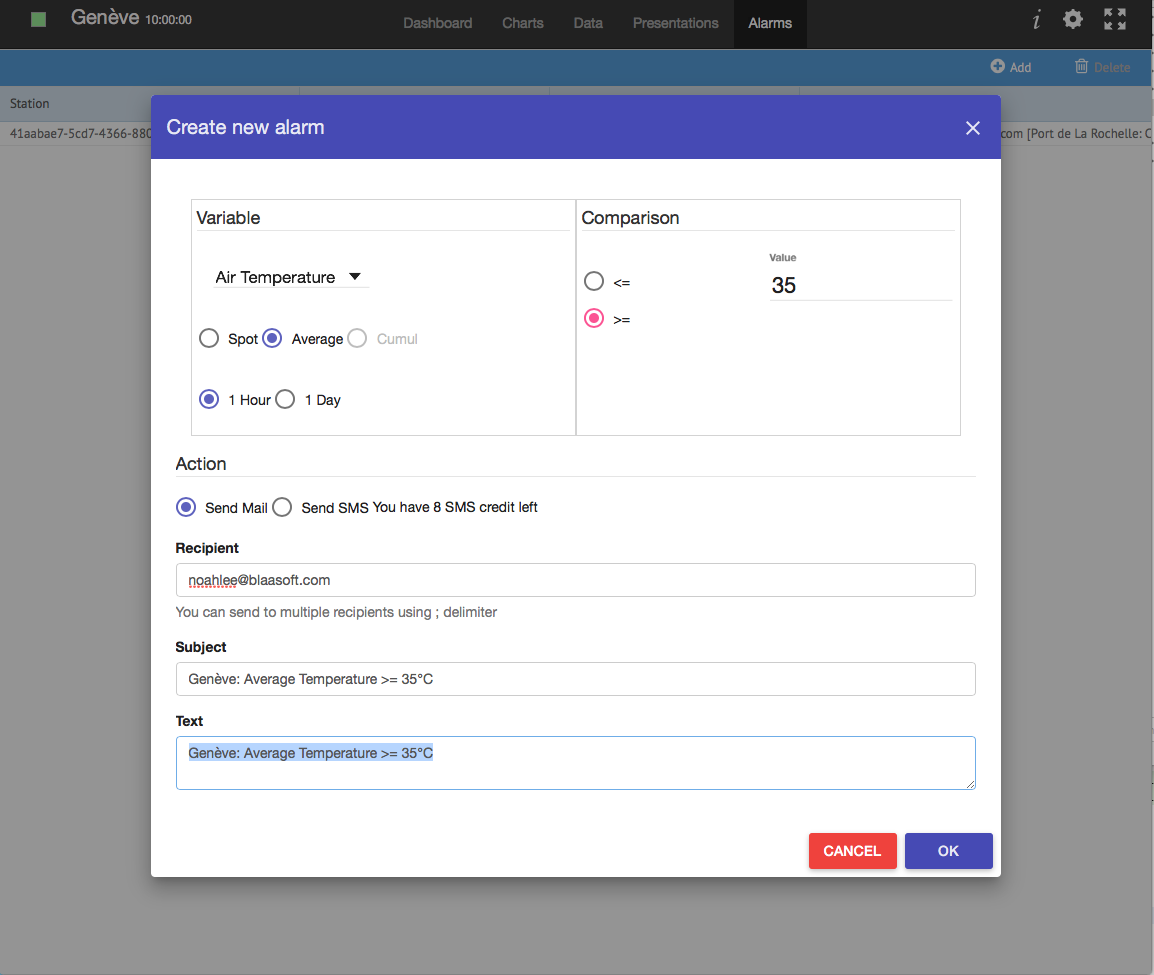
The Alarm panel
The Alarm panel allows you to create your own custom weather alerts. When a condition is reached (for example T > 25.0 °C) you will receive automatically an email. We can also offer SMS notification.
Another way to create custom alerts is to use our iOS applications for iPhone and iPad.